AWS Cloud Operations Blog
Analyzing Claude Code usage with CloudWatch and OpenTelemetry
Editor’s note (July 2026): This post has been updated to reflect the launch of Amazon CloudWatch Coding Agent Insights, a purpose-built experience for monitoring AI coding agent usage. The dashboard deployment section now references Coding Agent Insights for CloudWatch users, with the custom PromQL dashboard retained for Amazon Managed Grafana.
If your engineering organization uses AI coding agents like Claude Code, usage is likely growing faster than your ability to track it. Token consumption, cost per team, and developer productivity are questions that existing dashboards don’t answer, because the telemetry never made it to your observability backend.
With Amazon CloudWatch OpenTelemetry Protocol (OTLP) in General Availability, metrics ingestion is now possible with bearer token authentication. This means, tools that emit OTLP can typically ship metrics directly to CloudWatch with a single authorization header. No collectors, no sidecars, no IAM credential wiring on developer machines. Connect the signals in minutes and get per-developer cost attribution, team-level usage analytics, and operational alerting, all queryable with Prometheus Query Language (PromQL).
This post walks through the end-to-end setup for Claude Code. Although the focus here is Claude Code, comprehensive guidance for OpenAI Codex and GitHub Copilot is available on the AWS Observability best practices. This post focuses on bearer token authentication for its simplicity on developer machines. For organizations that require SSO (Single Sign-On) or OIDC (OpenID Connect) for developer authentication, see the Claude Apps Gateway for a reference implementation with federated identity.
Bearer token authentication
Bearer tokens (or CloudWatch metrics API key) allow tools running outside AWS (like Claude Code on developer laptops) to send metrics to CloudWatch without requiring the AWS SDK or IAM credential chains. Each token is tied to an AWS IAM user scoped exclusively to the CloudWatchAPIKeyAccess managed policy.
Important: Bearer tokens are long-term credentials. This post uses bearer tokens because AI coding agents run on developer laptops outside of AWS. SigV4 authentication would require either a central collector or running a collector process on every developer machine. Both approaches add operational complexity. Bearer tokens eliminate that infrastructure requirement entirely. For workloads running inside AWS where SigV4 with short-term credentials is feasible, prefer that approach for a stronger security posture. The CloudWatch OTLP endpoint requires HTTPS; requests over plain HTTP are rejected. For more information, see CloudWatch OTLP Metrics Bearer Token Auth.
Granularity strategy
Organizations control how granular their telemetry attribution is based on how they provision bearer tokens. At the finest level, each developer gets their own IAM user and bearer token, so attribution is inherent to the token itself. At a coarser level, a single token can be shared across a team or an entire organization, with identity attribution handled through client-side resource attributes instead. The following diagram illustrates these three approaches:
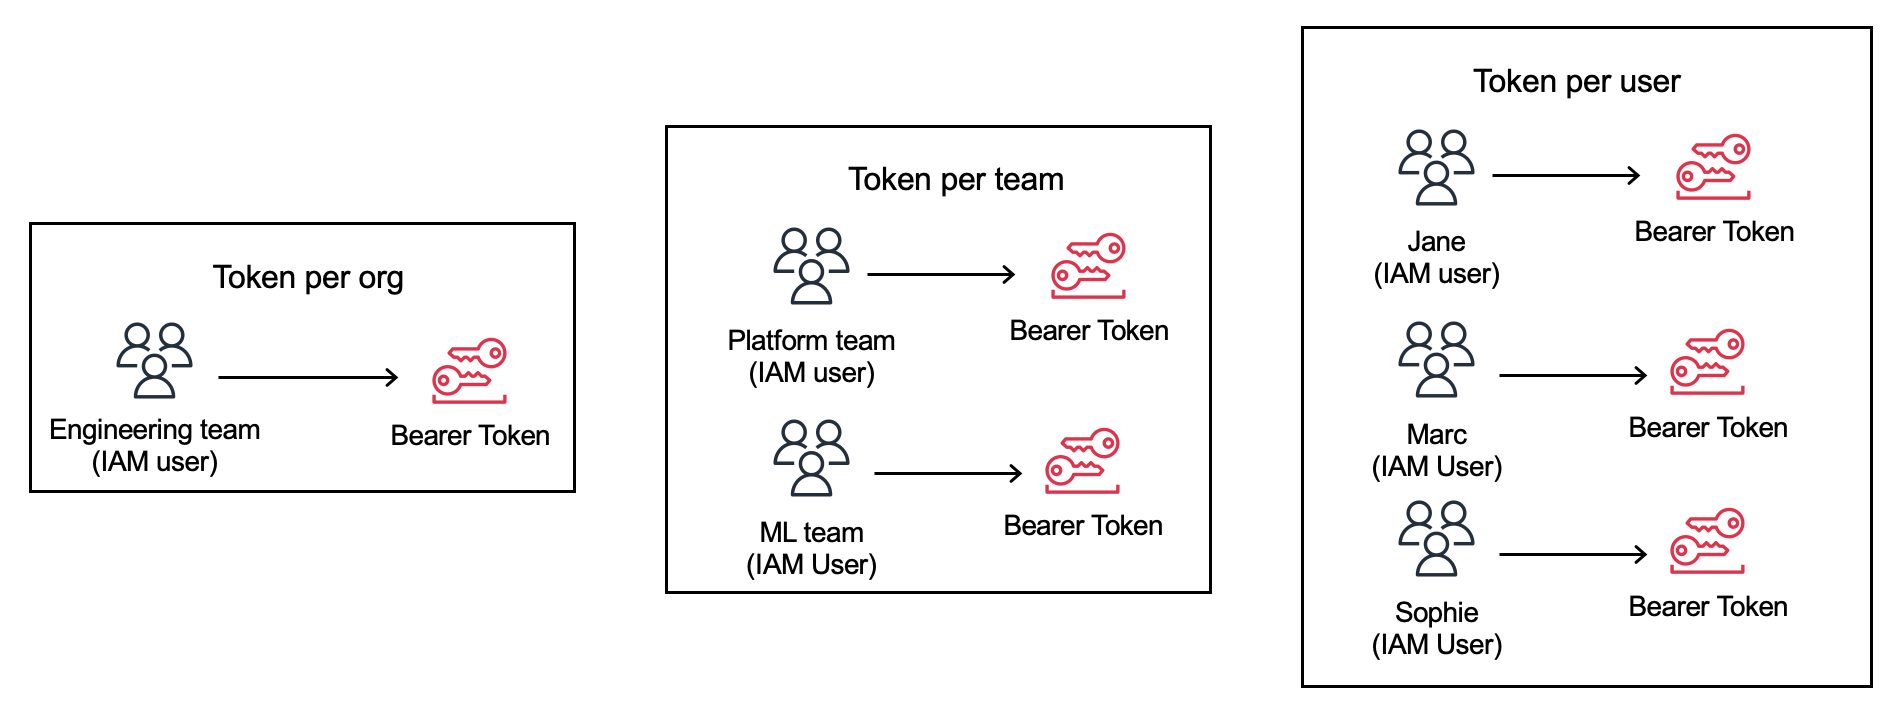
Figure 1: Token granularity strategy options
All three approaches produce identical dashboards and PromQL queries because attribution is driven by resource attributes, not the token itself. Start with a single shared token to validate the pipeline, then split to per-team or per-developer tokens as your security posture demands. Per-developer tokens are recommended when compliance requires credentials traceable to a named individual or when clean offboarding (revoking a single IAM user) is a hard requirement.
Prerequisites
- An AWS account with permissions to create CloudWatch resources
- AWS CLI v2 installed and configured
- Latest Claude Code version
- A CloudWatch metrics API key (generated below)
Create a bearer token via the console
In the CloudWatch console, navigate to Settings under the Setup section.
- Scroll to API Keys.
- Choose Create.
- Select an API key expiration.
CloudWatch creates the associated IAM user on your behalf with the CloudWatchAPIKeyAccess policy attached.
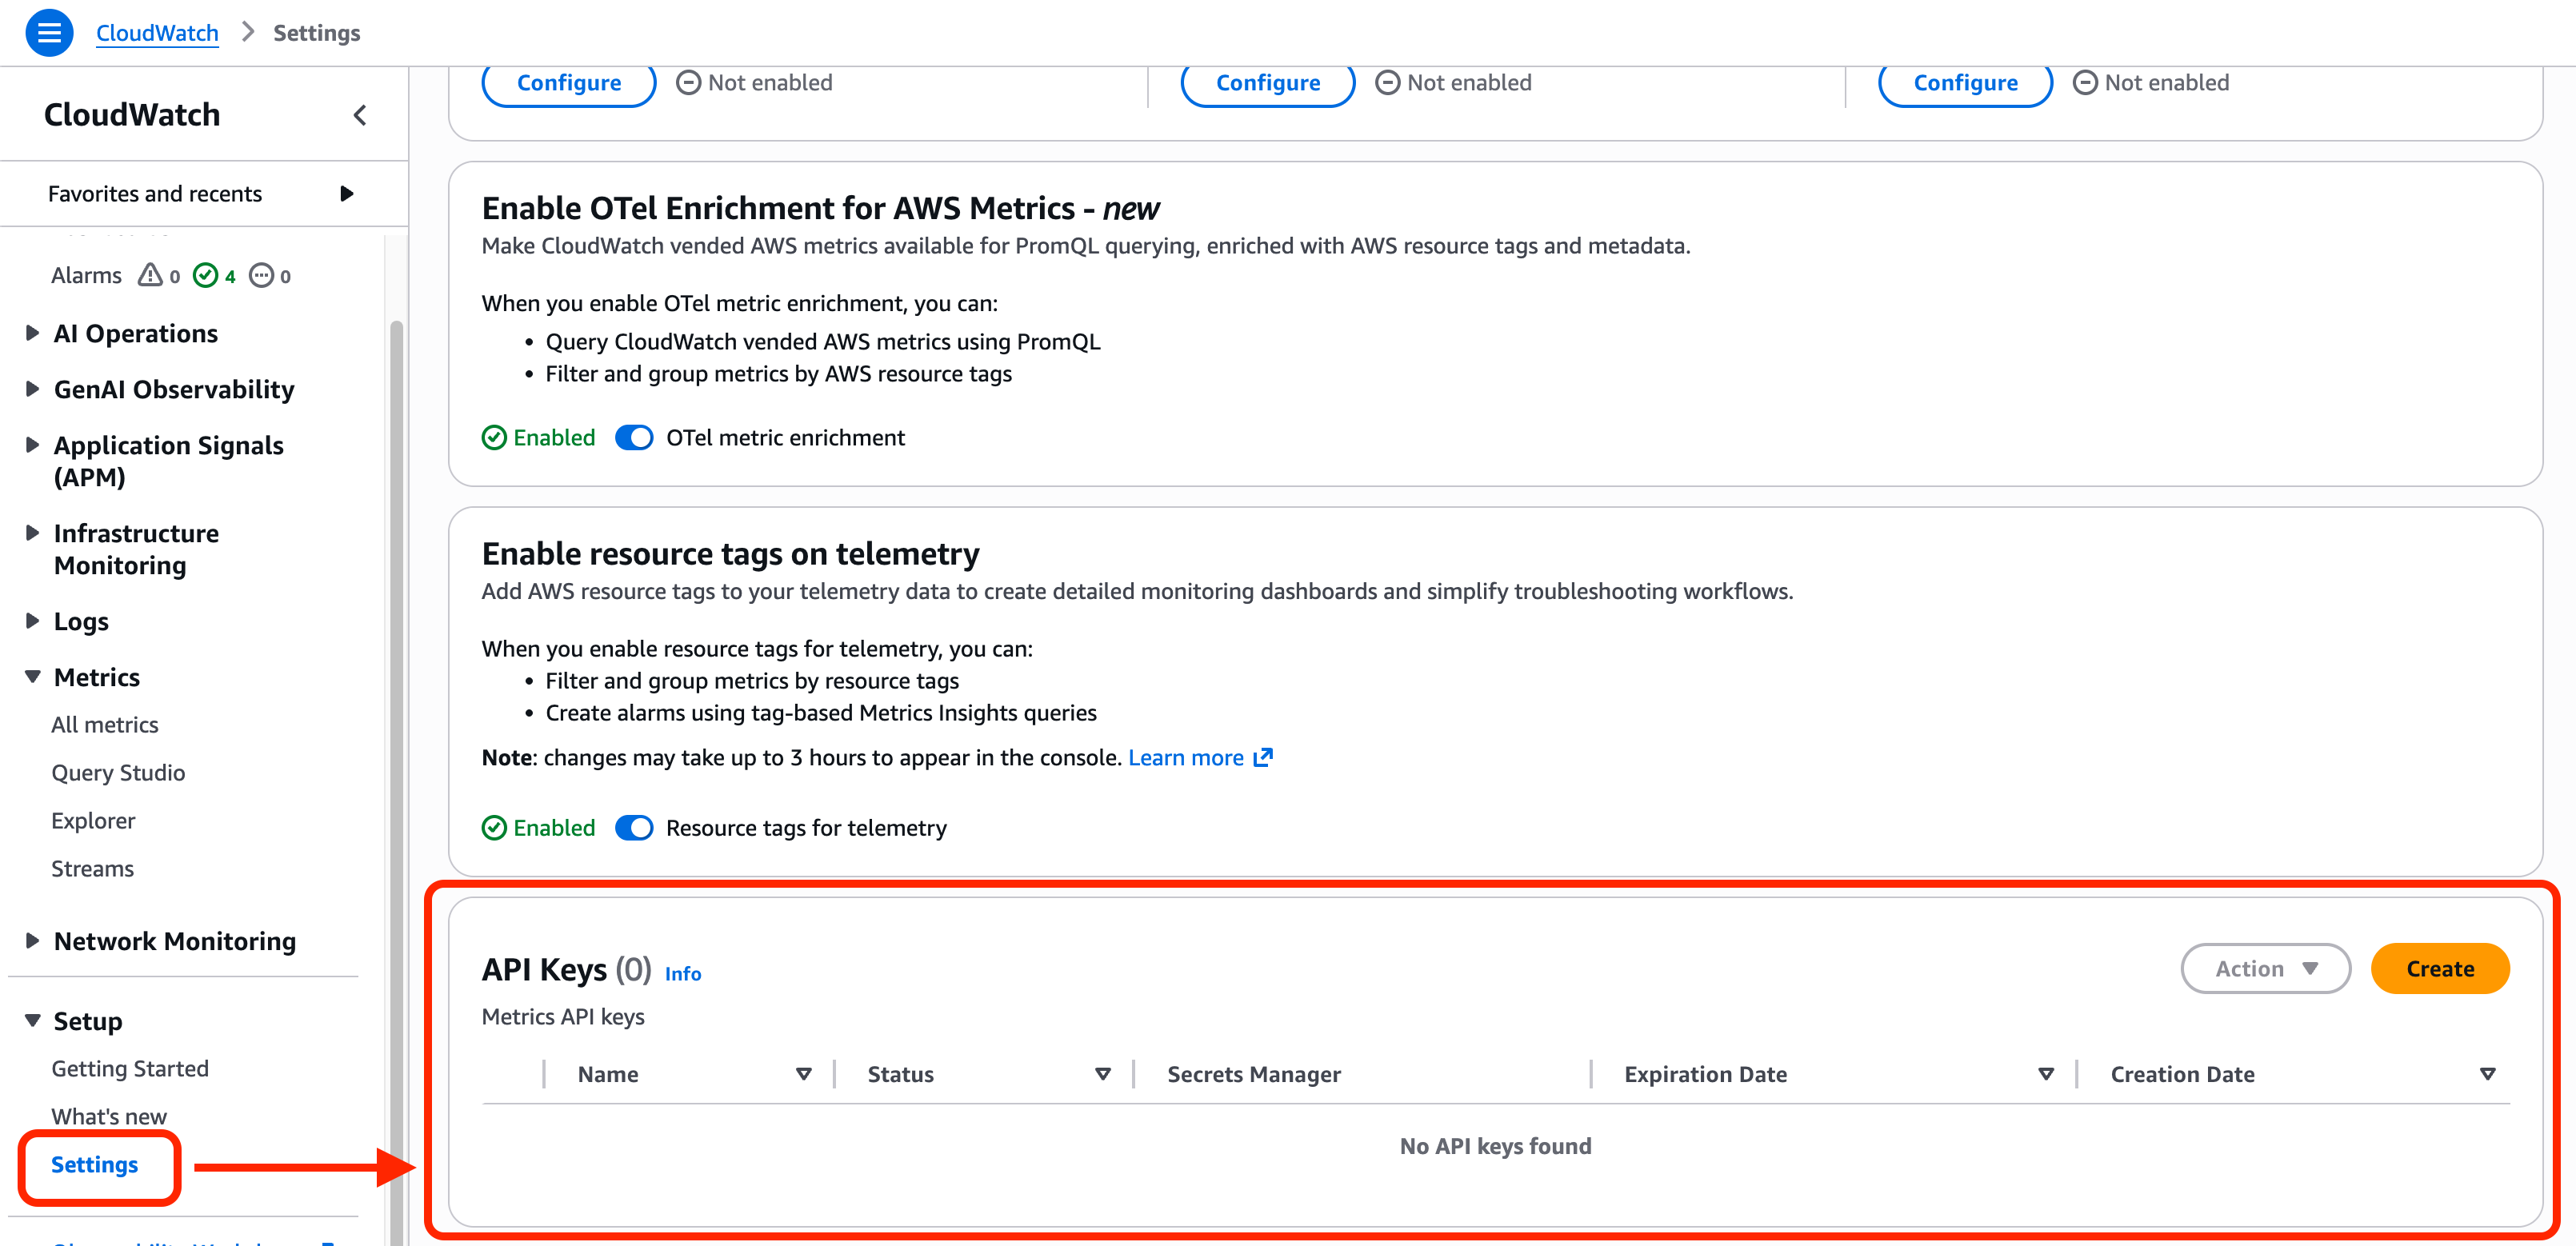
Figure 2: Creating a bearer token in the CloudWatch console Settings page.
Create a bearer token via the CLI
Alternatively, create a token with the CLI using the following commands:
# Create an IAM user for CloudWatch metrics ingestion
aws iam create-user --user-name cloudwatch-metrics-api-key-user

# Attach the CloudWatchAPIKeyAccess managed policy
aws iam attach-user-policy \
    --user-name cloudwatch-metrics-api-key-user \
    --policy-arn arn:aws:iam::aws:policy/CloudWatchAPIKeyAccess

# Create a service-specific credential for CloudWatch metrics ingestion
aws iam create-service-specific-credential \
    --user-name cloudwatch-metrics-api-key-user \
    --service-name cloudwatch.amazonaws.com
The response includes the ServiceCredentialSecret field, which is the bearer token value. Store it securely in AWS Secrets Manager or your organization’s vault solution. A reminder that you should never commit the token to version control. For automated key rotation, use AWS Secrets Manager rotation with a Lambda function.
Client-side configuration
With the bearer token set up, you can now configure Claude Code to export metrics. This approach uses client-side resource attributes set by each developer (or distributed via profile management).
# Retrieve token from Secrets Manager
BEARER_TOKEN=$(aws secretsmanager get-secret-value \
 --secret-id cloudwatch-otlp-bearer-token \
 --query SecretString \
 --output text)

export CLAUDE_CODE_ENABLE_TELEMETRY=1
export OTEL_METRICS_EXPORTER=otlp
export OTEL_EXPORTER_OTLP_PROTOCOL=http/json
export OTEL_EXPORTER_OTLP_ENDPOINT="https://monitoring.<AWS_REGION>.amazonaws.com"
export OTEL_RESOURCE_ATTRIBUTES="user.id=$(whoami),user.email=${USER_EMAIL},team.id=${TEAM:-engineering},cost_center=${COST_CENTER:-default},department=${DEPARTMENT:-engineering},environment=${ENV:-dev}"

# Security Note: Environment variables can be exposed through process listings and shell history.
export OTEL_EXPORTER_OTLP_HEADERS="Authorization=Bearer ${BEARER_TOKEN}"

# control export frequency (2s, for testing)
export OTEL_METRIC_EXPORT_INTERVAL=2000
Replace <AWS_REGION> with your target Region (for example, us-east-1, eu-west-1).
The OTEL_RESOURCE_ATTRIBUTES line attaches identity dimensions to every metric. Developers set these attributes directly. They become the PromQL labels for filtering and grouping in dashboards and alerts. Use whatever attributes your organization needs. The key requirement is consistency across your fleet so aggregations work.
| Attribute | PromQL label | Purpose | Example |
|---|---|---|---|
user.id |
@resource.user.id |
Per-developer attribution | jdoe |
user.email |
@resource.user.email |
Per-developer attribution (email) | jdoe@acme.com |
team.id |
@resource.team.id |
Team-level aggregation | platform-eng |
cost_center |
@resource.cost_center |
Finance/chargeback grouping | CC-4200 |
department |
@resource.department |
Org-level rollup | engineering |
environment |
@resource.environment |
Distinguish dev/staging/prod usage | production |
You can find the full list of standard attributes and metrics available in the Claude Code documentation.
For fleet-wide enforcement of telemetry settings and privacy controls, Claude Code supports admin-managed settings deployable through your organization’s profile management solution.
Verify metrics are flowing
After setting the environment variables, run a short Claude Code session:
# Start a brief session
claude -p "Let's conquer the world" --max-turns 1
To verify metrics are flowing, open CloudWatch Query Studio and enter claude_. You will see a few metrics such as claude_code.token.usage which tracks the number of tokens used.
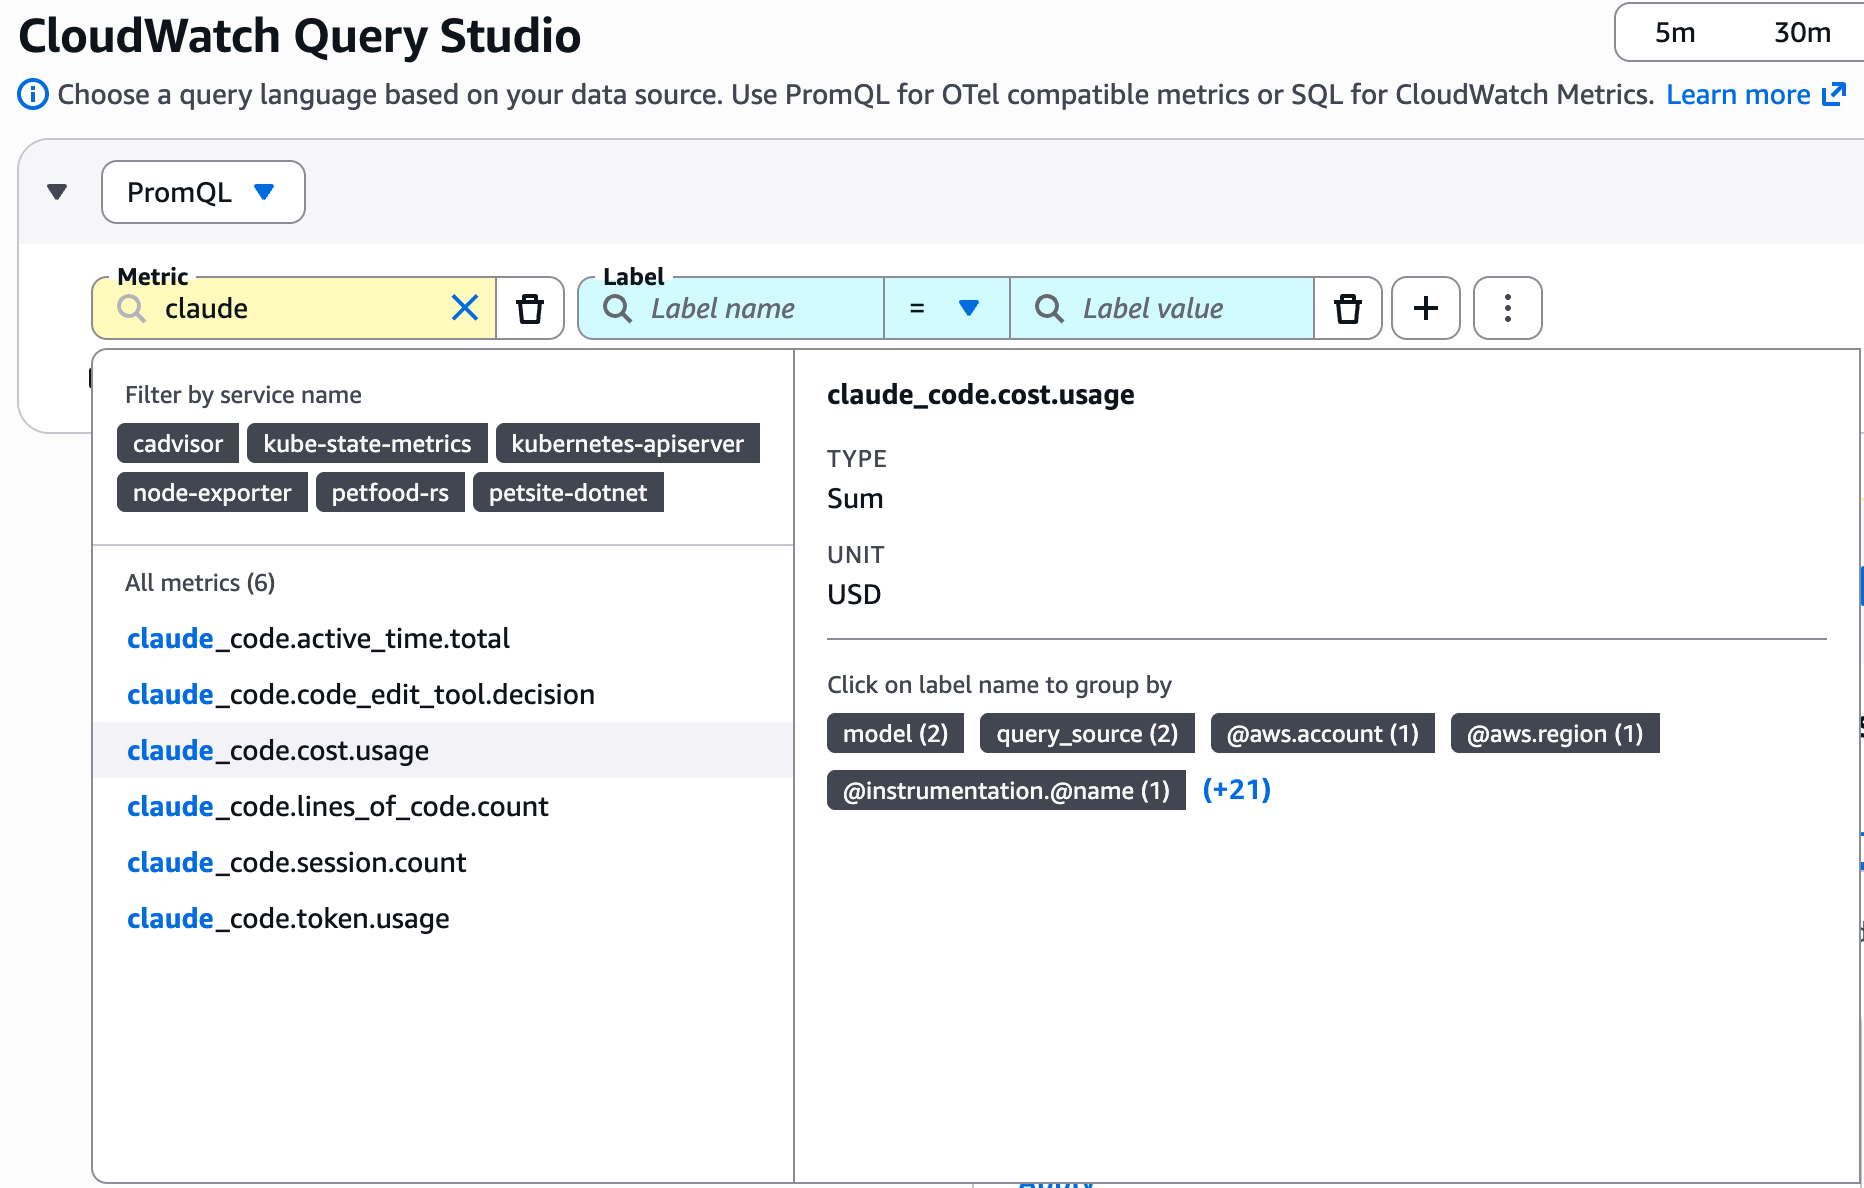
Figure 3: Verifying metrics ingestion in CloudWatch Query Studio.
Coding Agent Insights
Amazon CloudWatch Coding Agent Insights provides a purpose-built console experience for monitoring AI coding agent usage across your organization. Rather than deploying and maintaining custom dashboards, you get an out-of-the-box view of token consumption, cost, and developer activity — powered by the same OpenTelemetry metrics you configured in the previous section.
Coding Agent Insights works with Claude Code, OpenAI Codex, and GitHub Copilot. As long as your agents export OpenTelemetry metrics to CloudWatch using the resource attributes described in the client-side configuration section, the data appears in the Insights console automatically.
To access Coding Agent Insights, open the CloudWatch console and choose Coding Agent Insights under the GenAI Observability section in the navigation pane.
Executive summary
The top row provides key totals for your current filter selection: total tokens consumed, total cost, active users, sessions, cache hit rate, and active hours. Tabs at the top let you switch between Claude Code, Codex, and Copilot.

Figure 4: Coding Agent Insights executive summary with key totals and agent tabs.
Dynamic filtering
The Insights experience lets you slice and dice your data using the OpenTelemetry resource attributes attached to each metric. The left panel provides two controls:
- Group by: Choose one or more dimensions (Department, Team, User, Model) to break down all charts by those attributes.
- Filter by: Narrow results by Model, Organization, Department, Cost Center, Location, Team, User, or Role.
For example, filter on a specific AI model (such as claude-sonnet-4-6) and group by Department and Team to see which teams are driving consumption on that model. The summary cards and all downstream charts update instantly to reflect your selection.

Figure 5: Dynamic filtering by AI model, grouped by department and team.
Usage and cost
This section answers the question engineering leaders ask first: “How much are we consuming, and where is it going?“. It shows token usage over time, token usage broken down by your selected grouping (department, team, or user), cost by grouping, and token usage by type (input, output, cache read, cache creation). Use these panels to identify which teams are driving spend and to track cache efficiency.

Figure 6: Token consumption over time, by department, cost by department, and token type breakdown.
Developer productivity
Beyond cost, this section tracks what developers are actually producing with the tool: lines of code added and removed, commits, active coding hours, and pull requests, all broken down by your selected grouping. Use these panels to correlate token spend with tangible engineering output.

Figure 7: Lines of code, commits, active hours, and pull requests by department.
Code editing
This section provides deeper insight into how developers interact with agent-generated code: which programming languages the agent produces code in, whether developers accept or reject suggested edits, and which editing tools are used. The language breakdown reveals which parts of the codebase benefit most from AI assistance. The accept/reject ratio is a signal of how well the agent’s suggestions align with developer intent.

Figure 8: Language distribution, edit decisions (accept/reject), and edits by tool.
Alerting
Every panel in the dashboard is backed by a PromQL query. To create an alarm from any panel:
- Open the panel you are interested in (for example, token usage by user).
- To open the underlying query, choose View in Query Studio.
- Choose Create alarm directly from Query Studio.
- Adjust the query or thresholds as needed.
You can also write custom PromQL alarm queries for scenarios that go beyond what the dashboard shows. Here are a few examples:
Individual spend spike
If someone spends more in 1 hour than 2x their entire previous day’s spend, that indicates an anomaly. This catches runaway loops, stuck agents, or compromised tokens.
sum by("@resource.user.email") (increase({"claude_code.cost.usage"}[1h]))
> 2 * avg_over_time(sum by("@resource.user.email") (increase({"claude_code.cost.usage"}[1h]))[24h:1h])
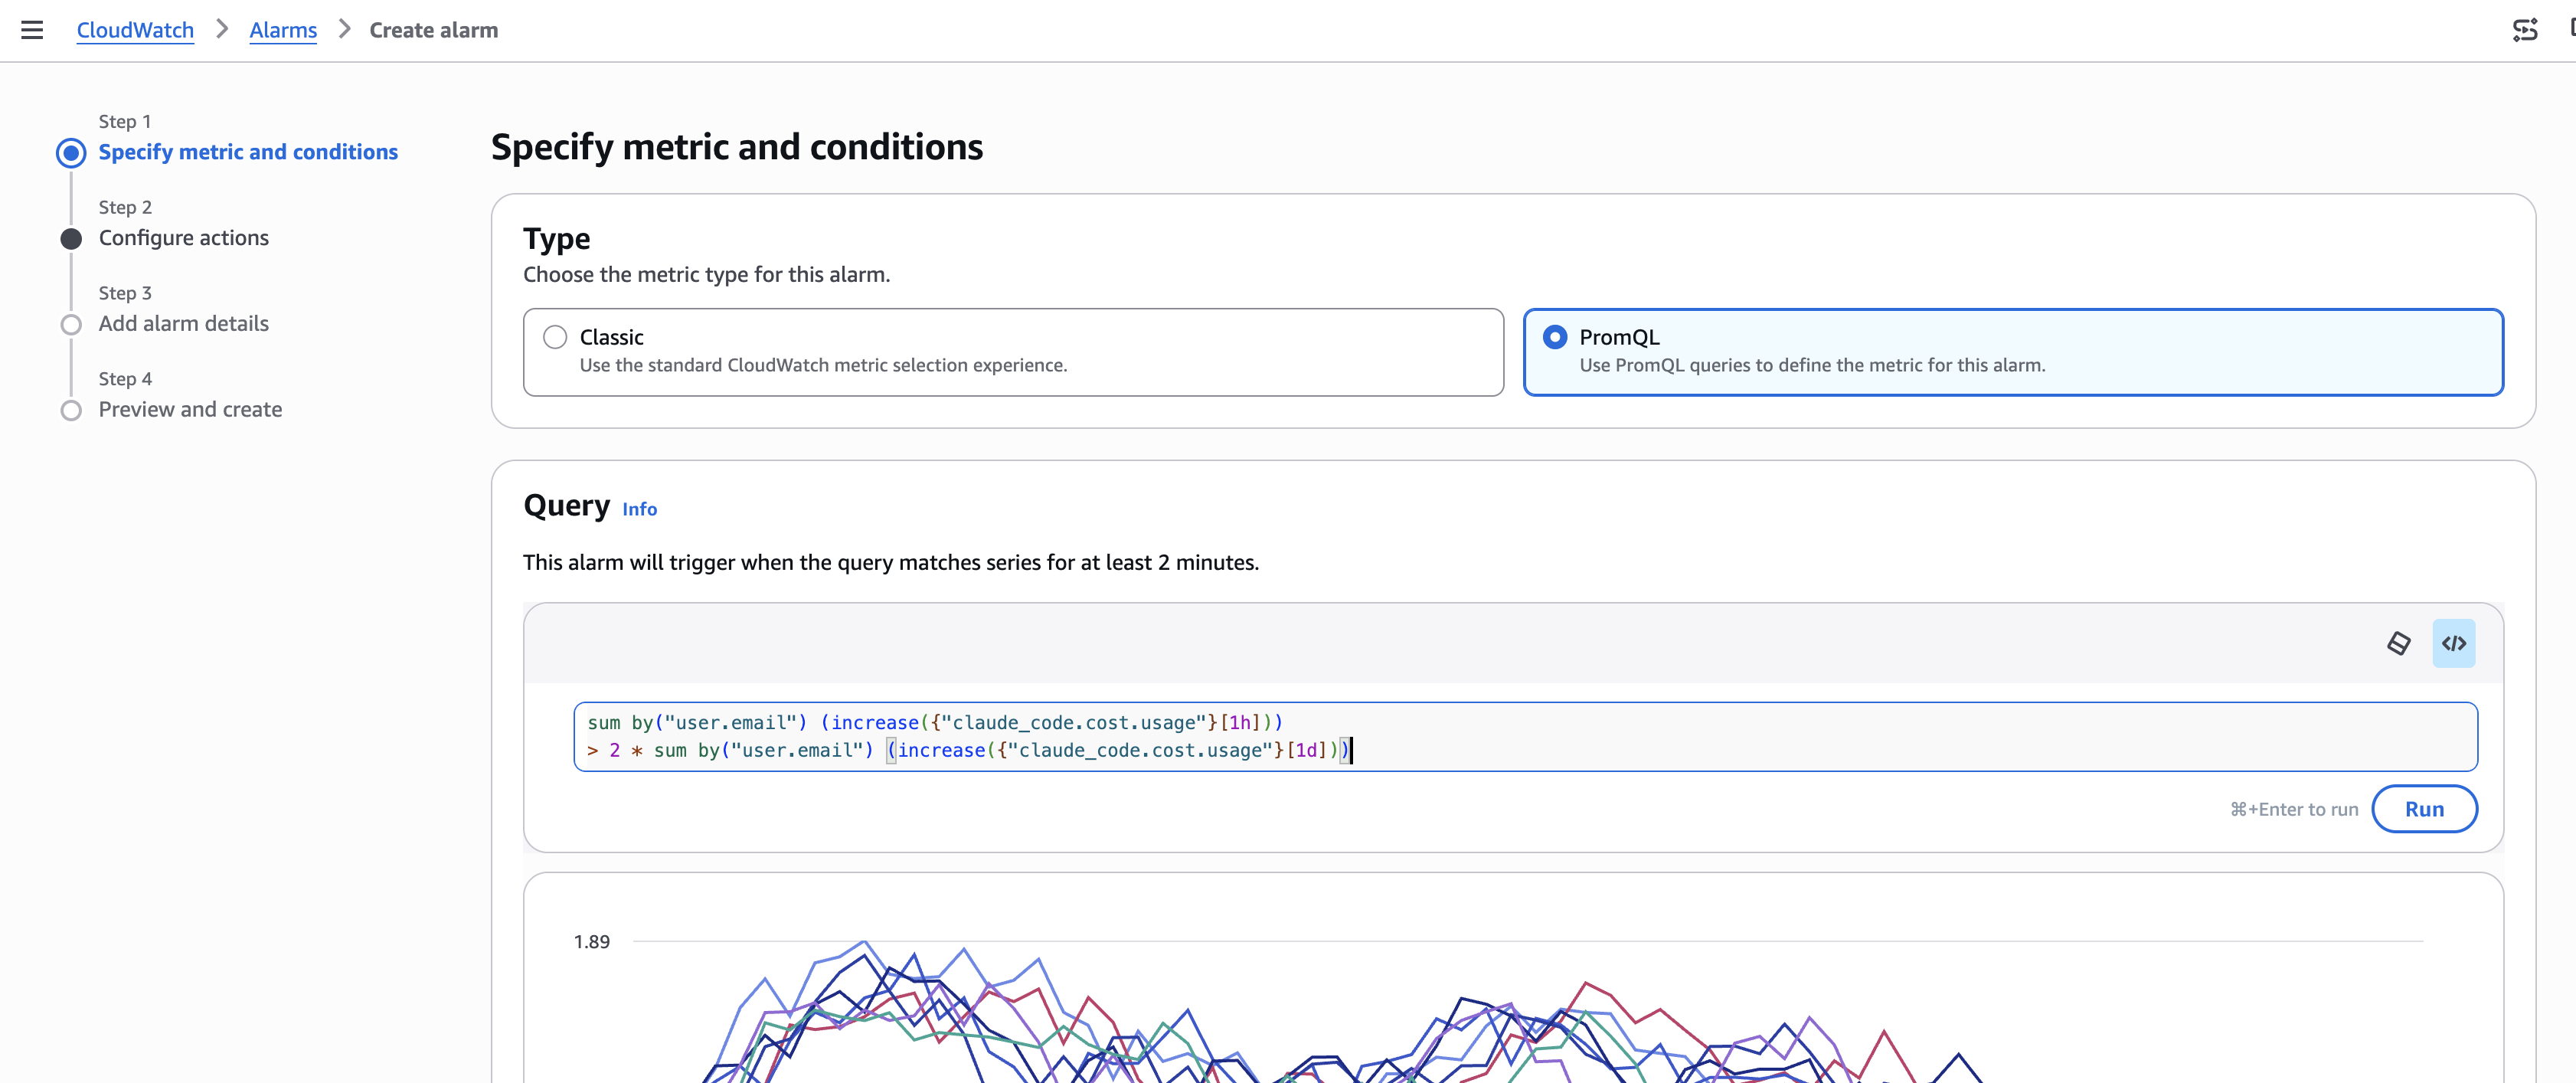
Figure 9 – PromQL alarm for user usage in 1h greater than his daily usage
Team budget threshold
Alert when a team’s daily spend exceeds a defined budget:
sum by ("@resource.team.id") (increase({"claude_code.cost.usage"}[24h])) > 500
Adoption regression
Detect when a team’s daily sessions drop below 50% of their 7-day average, a signal of potential tooling issues or access problems:
sum by ("@resource.team.id") (increase({"claude_code.session.count"}[1d]))
< 0.5 * avg_over_time(sum by ("@resource.team.id") (increase({"claude_code.session.count"}[1d]))[7d:1d])
Using the dashboard in Amazon Managed Grafana
If you use Amazon Managed Grafana or self-managed Grafana, follow the query from Grafana documentation to add CloudWatch as a PromQL data source, then import the Grafana dashboard JSON.
Cost estimate
For a 200-developer organization where each developer runs ~20 sessions per day, each emitting ~7 metric data points with resource attributes, and developers are active ~22 days/month:
A typical OTLP data point with 10-15 attributes is 300-600 bytes. Using 450 bytes as a midpoint:
200 developers × 20 sessions/day × 7 metrics × 450 bytes = 12.6 MB/day
12.6 MB/day × 22 days = ~277 MB/month ≈ 0.27 GB/month
At $0.50/GB ingestion, that is ~$0.14/month for the base case. Even with high-cardinality metrics (100x volume), total ingestion stays under $14/month. PromQL queries in the CloudWatch console are free.
The total cost for 200 developers, in this example, would be under $15/month.
Visit the Amazon CloudWatch Pricing page for the latest updates.
Cleanup
Important: CloudWatch retains metrics up to 15 months at no charge. Delete alarms and IAM resources to avoid ongoing costs and security exposure.
Follow these commands to remove all the resources you have created:
# Delete CloudWatch Alarms
aws cloudwatch delete-alarms --alarm-names <alarm-name> --region <AWS_REGION>

# Delete service-specific credential
aws iam delete-service-specific-credential --user-name cloudwatch-metrics-api-key-user --service-specific-credential-id <credential-id>

# Detach policy from IAM user
aws iam detach-user-policy --user-name cloudwatch-metrics-api-key-user --policy-arn arn:aws:iam::aws:policy/CloudWatchAPIKeyAccess

# Delete IAM user
aws iam delete-user --user-name cloudwatch-metrics-api-key-user

# If using Secrets Manager, delete the secret
# WARNING: Deleting the secret is irreversible. The bearer token cannot be recovered.
# Ensure you no longer need the token before proceeding.
aws secretsmanager delete-secret --secret-id <secret-name> --region <AWS_REGION>
To stop telemetry export, unset the environment variables or remove them from your shell profile:
unset CLAUDE_CODE_ENABLE_TELEMETRY OTEL_METRICS_EXPORTER OTEL_EXPORTER_OTLP_ENDPOINT OTEL_EXPORTER_OTLP_HEADERS OTEL_RESOURCE_ATTRIBUTES
Conclusion
In this post, you configured Claude Code to export OpenTelemetry metrics to Amazon CloudWatch using bearer token authentication, deployed a PromQL-powered dashboard for cost and usage visibility, and set up alerting for spend anomalies and adoption regression.
The same CloudWatch OTLP endpoint accepts telemetry from any OpenTelemetry-instrumented workload, not just IDE agents. For large organizations with multiple accounts and Regions, General Availability also introduced cross-account, cross-Region metrics centralization, which enables metrics collection into a single observability account for unified visibility.
Checkout the complete guide on how to setup IDE observability for GitHub Copilot, and OpenAI Codex.